SightMill
Make sense of your data and understand your feedback
Step 3
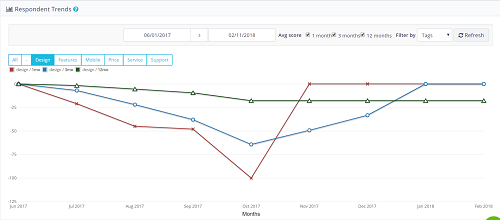
To make sense of the data, categorise your customer feedback by theme, or by product, location, customer segment, sales rep, or in any way you want.
Now, you can see graphs of your customer's engagement by theme - for example, how this changes as you make changes to your product or customer service.