 SightMill

May 2020
 Are you making the best use of the data available to you? Right now, marketing, sales and customer service teams have access to an explosion of data sources to track that can help improve and enhance a campaign or business process and you’ve got an opportunity to look at and optimise the metrics that drive the online part of your business.
 To get the most out of this process, you’ll need to:
- Identify what are the right metrics to measure (and avoid those vanity metrics)
- Plan how you’ll measure (without wasting your time)
- Follow through with actions; and keep adjusting actions and review to see the impact
- Promote the results as part of a positive feedback loop
In short, once you’ve decided on the metrics, you’ll need to work to test and transform actions into business outcomes.
We’ve laid out this ‘identify, measure, improve, promote’ model to help you get more out of whatever metrics you need to track. Consider it a guide to dealing with any type of metric (with an emphasis on the marketing/sales/customer experience paradigm mentioned above), but be flexible — adapt this to your own working models where necessary.
The Identify stage
This seems like an obvious step, but stop and think here. What would it be useful for you to measure, and why?
I’ve worked with teams where we’ve spent days thinking about this part of the problem – it’s often a lot harder than you might think. If you’ve not read it, there’s a great section in lean analytics about the one metric that matters that walks you through a set of examples to help identify which is the right metric to measure.
This step to identify the right metric is incredibly important since it will define every other part of the process. For example, if you decide to focus on a metric of organic visitors to your website you’ll get a good view on the SEO elements of your site, but it misses out a whole range of key elements (such as referrals, existing users coming in direct, etc). Alternatively, if you measure pages per session then you get a view on engagement but won’t help with traffic sources.
Ideally, if you can distill business success to one metric, then that’s great. For example, a subscription business might be all about usage by paying subscribers (this will be influenced by a range of initiatives but ultimately should help reduce churn, improve onboarding, and new sign-ups). At worst, try and get it to two metrics and then we can move forward.
So how do you start this process? Given that there are so many metrics you could track, our advice is to avoid focusing on the metric itself, initially at least. Instead, identify what your business model has at its core or what key element you’d like to improve, and work backwards from there. Keep things goal-driven rather than process-focused at this stage.
This could be as simple as ‘we’d like to improve our customer service levels’ or ‘we want to increase customer loyalty’, or something more specific — ‘why do such a high percentage of people fall off our app on this particular user journey?’, for example. From there, look into what sort of data you’d need to inform any improvements you’d like to make.
The Measure step
Once you’ve identified the right metric to drive your business goals, and what you would like to improve to achieve this, it’s time to start thinking about how you’re going to measure this.
And, as is so often the case, it’s down to the right tools.
So, ‘measuring’ your chosen metrics isn’t as simple as just getting started. You may well need to navigate executive buy-in for your project, negotiate a budget for new software and train your team to use them before setting off. This isn’t true in 100% of cases — you might be able to use something you already have, or create a solution yourself — but it is something worth bearing in mind. (We’ve written about embedding new processes and metrics)
Finding the tools that work for you
You know the metrics you need to measure to make a difference. You know, roughly, what you need to measure it. From here, you need to figure out:
- Whether you need any new tools, or whether you could use your existing software. It’s easy for vendors to update software these days and there could well have been some features that you missed on these, especially if they weren’t a priority at the time
- Whether your existing software vendors offer any sister solutions or customisation that would expand your functionality. It’s not a guarantee (and you might well find something better suited to your needs elsewhere) but it’s a natural place to start.
- Whether you could buy these with your existing department budget or would need to put together a business case for sign-off.
- Who the key stakeholders are in your purchase (for example, customer experience software might involve marketing, sales, and customer service key stakeholders, regardless of the department actually doing the purchasing)
- Which features you’d need, which features you’d like and which features are an added bonus (or perhaps wouldn’t get used)
- A software shortlist, which you can narrow down and ultimately decide from based on speaking to vendor reps, free trials and guided demos.
Ultimately, selecting the right software for you is a topic that’s worth going into in more depth than we have space for here. Read more about how to approach software selection with this free guide.
Three quick tips to sign-off
We’re not about to go down a maze of how-to-navigate-your-company (there are many, many books on this!) but here are three quick tips that might help.
- It makes it easier to sign-off a purchase if you include numbers to help the decision-maker come to a fact-based decision. Alongside every benefit you list in your business case for a new software or tool, include how it will generate revenue or save costs for the business (e.g by increasing repeat customers or saving enough time to avoid hiring more staff).
- Draw-up a quick requirements list. A good way of doing this is to survey the existing market before making any purchase decisions and look at the feature charts — if you need a new piece of software, what must it do? What would be an added bonus? A good chunk of software vendors offer no-strings free trials.
- Consider benefits to all departments and how many people need access to the software. If you’re a small company, could you make do with one user account, or fewer survey responses per month, or a capped number of CRM contacts? Alternatively, could you spread the benefit between multiple departments?
Setting a baseline and KPIs
 You’re all set. You’ve got the tools set up, your team know how to use them and you’re ready and waiting
 But wait. What are you measuring against? What is your definition of success?
If you don’t define what you’re aiming for early on, your project risks anything between lack of focus (at best) to derailment as you discover that you don’t know where you started, where you’re going or what you need to improve on (at worst).
Setting KPIs for the data you’re measuring will help you avoid this pitfall. Simply put, a KPI (key performance indicator) is a target of sorts. You might set an initial KPI of 50% positive online reviews per month as an indicator of how well you’re doing.
If you’re working in an agile way, then you’ll probably try and couple of experiments every month – each with the aim of improving against the KPI. To start with, you’ll need an element of guesswork in setting these — avoid being overly optimistic and aim for small, regular checkups rather than one big annual goal. This is important for a number of reasons:
- A fortnightly or monthly check on progress against your metrics allows you to adjust. If something doesn’t work, stop it; if something works, do more of it! It’s hard to do this on an annual review.
- An iterative approach of test-adjust-repeat works very well online since in many cases you can automate this process and it’s quick and easy to make changes
- For your team, missing a big annual goal is much more of a morale killer than missing small, regular ones — never underestimate how important this is for team engagement, performance, and ultimately the success of the project.
- Regular targets are more adjustable. Smashing it? Up your targets for the next few months and really take things to the next level. If you’re not doing so well, you have plenty of space to figure out what the issue is, or to decide that your current targets were unworkable and adjust accordingly.
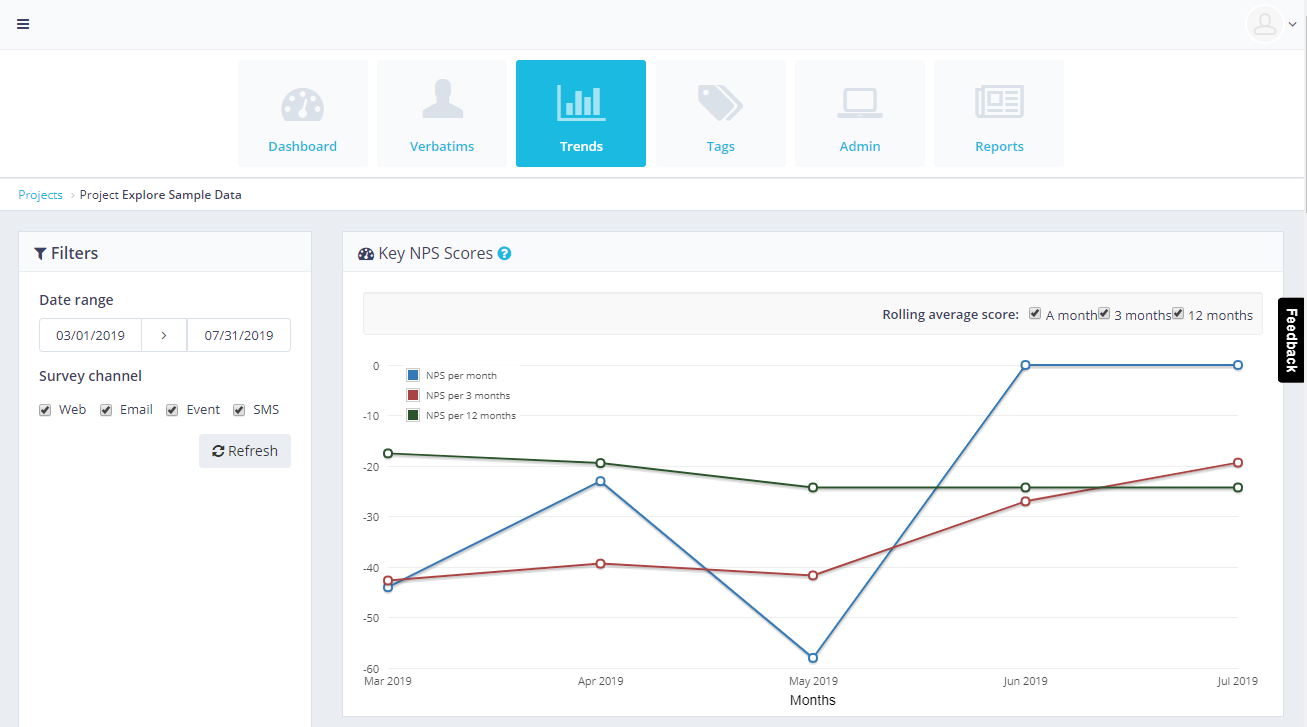
- Trend is incredibly important along with the actual metric; take customer engagement metrics like your NPS score. The actual NPS score is useful, but the real driver of process and product improvement is the trend (are your actions causing your score to go up or down).
The Improve step
Given that anything you can measure is, essentially, a metric, how you proceed here will depend on what you’re measuring.
For behavioural data
If you’re running an online product (a website, app or service) then it’s likely that much of your underlying data will be around behaviours. For example, will a visitor click on a blue button more often than a yellow button; do subscribers from Chicago upsell more often based on price or on features; do email click-throughs to your site convert more or less often than organic visitors?
With many of these behavioural data sources, you can automate (or semi-automate) your process to help deliver results against your targets without your manual intervention. For example, if you have two versions of a headline text to a landing page, you can setup a range of tools to show these to different audience groups and automatically test to see which converts best. Tools such as Unbounce.com, Leadpages.net, ABTasty.com, even Google Analytics, will all help you do this.
If you’re measuring a data point that does not translate so easily into an action – perhaps it’s linked to an offline process – then you’re going to have a little more work to do figuring out what your next steps are. The numbers can suggest where your issues might lie, but it’s up to you to analyse them and work out what course of action it’s best for you to take. To help you, consider these:
- Follow-up surveys: you’ve identified what you think might be an issue. Let the key groups affected by this issue tell you more. For example, if you’re looking at high bounce-rates, you could set up exit surveys on your website to get to the bottom of a particularly high bounce rate.
- A/B testing: test new ideas out against a control group by showing 50% of people an updated version and 50% of people the original. This works well with things like web layouts and email subject lines where you can offer a clear cut, ‘one or the other’ option.
- Focus groups/user panels: more open-ended than the two options above, focus groups or user panels allow a more conversational approach which might throw up issues or solutions you hadn’t previously considered.
Improvements based on survey data
If you’re using a survey-based metric (like NPS score, CSAT or other key customer-based metrics), unhappy customers will quickly tell you what are the problems you need to address.
However, this feedback also comes with a requirement to commit to making an improvement. There’s nothing worse than asking for feedback and then not acting on it.
The key here is analysis to clearly identify the problem and then communication (internally with your teams and externally with your customers). Many customer feedback software platforms can automatically tag comments by content, theme or sentiment, so you should be able to get a good idea of what you need to work on straight away.
Try and operate as fast as possible: sending an email as soon as you close off responses thanking people for their time, and explaining how you will be working to improve things over the next few weeks/months will do enormous amounts for goodwill among the people who completed the surveys.
Tip: a great tip to add to your survey emails, which we’ve seen also really helps with response rates, is to list a couple of topics that feedback identified and have been improved as a result of survey responses.
Once you’ve completed the steps above, try and put in place a process across teams to do it again, and make this part of general operating process. It takes a while to work through this process, and once you start making improvements you will start to see improvements as you track against your metrics.
The Promote step
 This final step won’t be relevant to every single thing you track...but it’s worth stopping to think whether there’s anything more your metrics could be doing for you.
Would the speed at which you fix common issues with your product or website impress new customers, or keep existing ones for longer?
Would a good NPS or CSAT score (or a high rating on external review sites) draw more people to your business?
Start thinking how you can use the improvements you’ve made by measuring your metrics as an alluring marketing tool.
Conclusion
We’ve covered a range of ways to understand, analyse and act to improve your marketing using data and metrics. We’ve picked examples to explain the topics, but would love to hear your ideas: if you have worked with a particular metric or process that has improved your marketing and so your business, please get in touch.